
November Update Part 3 – Why, When and Extreme King Tides
Click here for the original Update for November
Click here for Update 2 – Resources, What to do and what not to do
People have been asking if the tides are really going to be a problem – yes, we really think so.
This information has been gathered and shared with the intention of sharing the most accurate information we could find.
To my knowledge, no sources predicted accurately the events over the past two months
Please use your own judgement and confirm with your own research. If you find information that is clearer or more accurate please share!
Better to be prepared than caught off guard!
November Updates:
- Nov 16, 2026 November Update
Preparing for King Tides - Nov 17 2026 Part 2 with resources
What you should and should not do - This page Nov 20 2026 November Update 3:
On this page Update 3:
Why do we anticipate super high King Tides this coming week?
Predicted vs Observed or actual tides have been very different this fall.
People who have lived in the area have recollections from the 60’s recall extreme high tides
a decade prior to the harbor extending north of Channel Islands Blvd.
The weather patterns from El Nino have been extreme and the higher than predicted tides have not receded.
Most tide charts do not show adjusted predictions based on actual tides.
The chart below is “predicted” not “anticipated” tide.
The tides in Channel Islands Harbor have been running higher than predicted tides since October when a 6.6 ft predicted tide went over 8 ft.
If a 6.6 ft predicted tide was 8 ft
There is no accurate idea as to what a predicted 7 ft will be.
I have found it a bit frustrating to NOT find up to date data regarding predicted vs actual tides from reliable sources and have discovered that there are not live monitoring stations at very many locations along the coast.
When to watch your dock
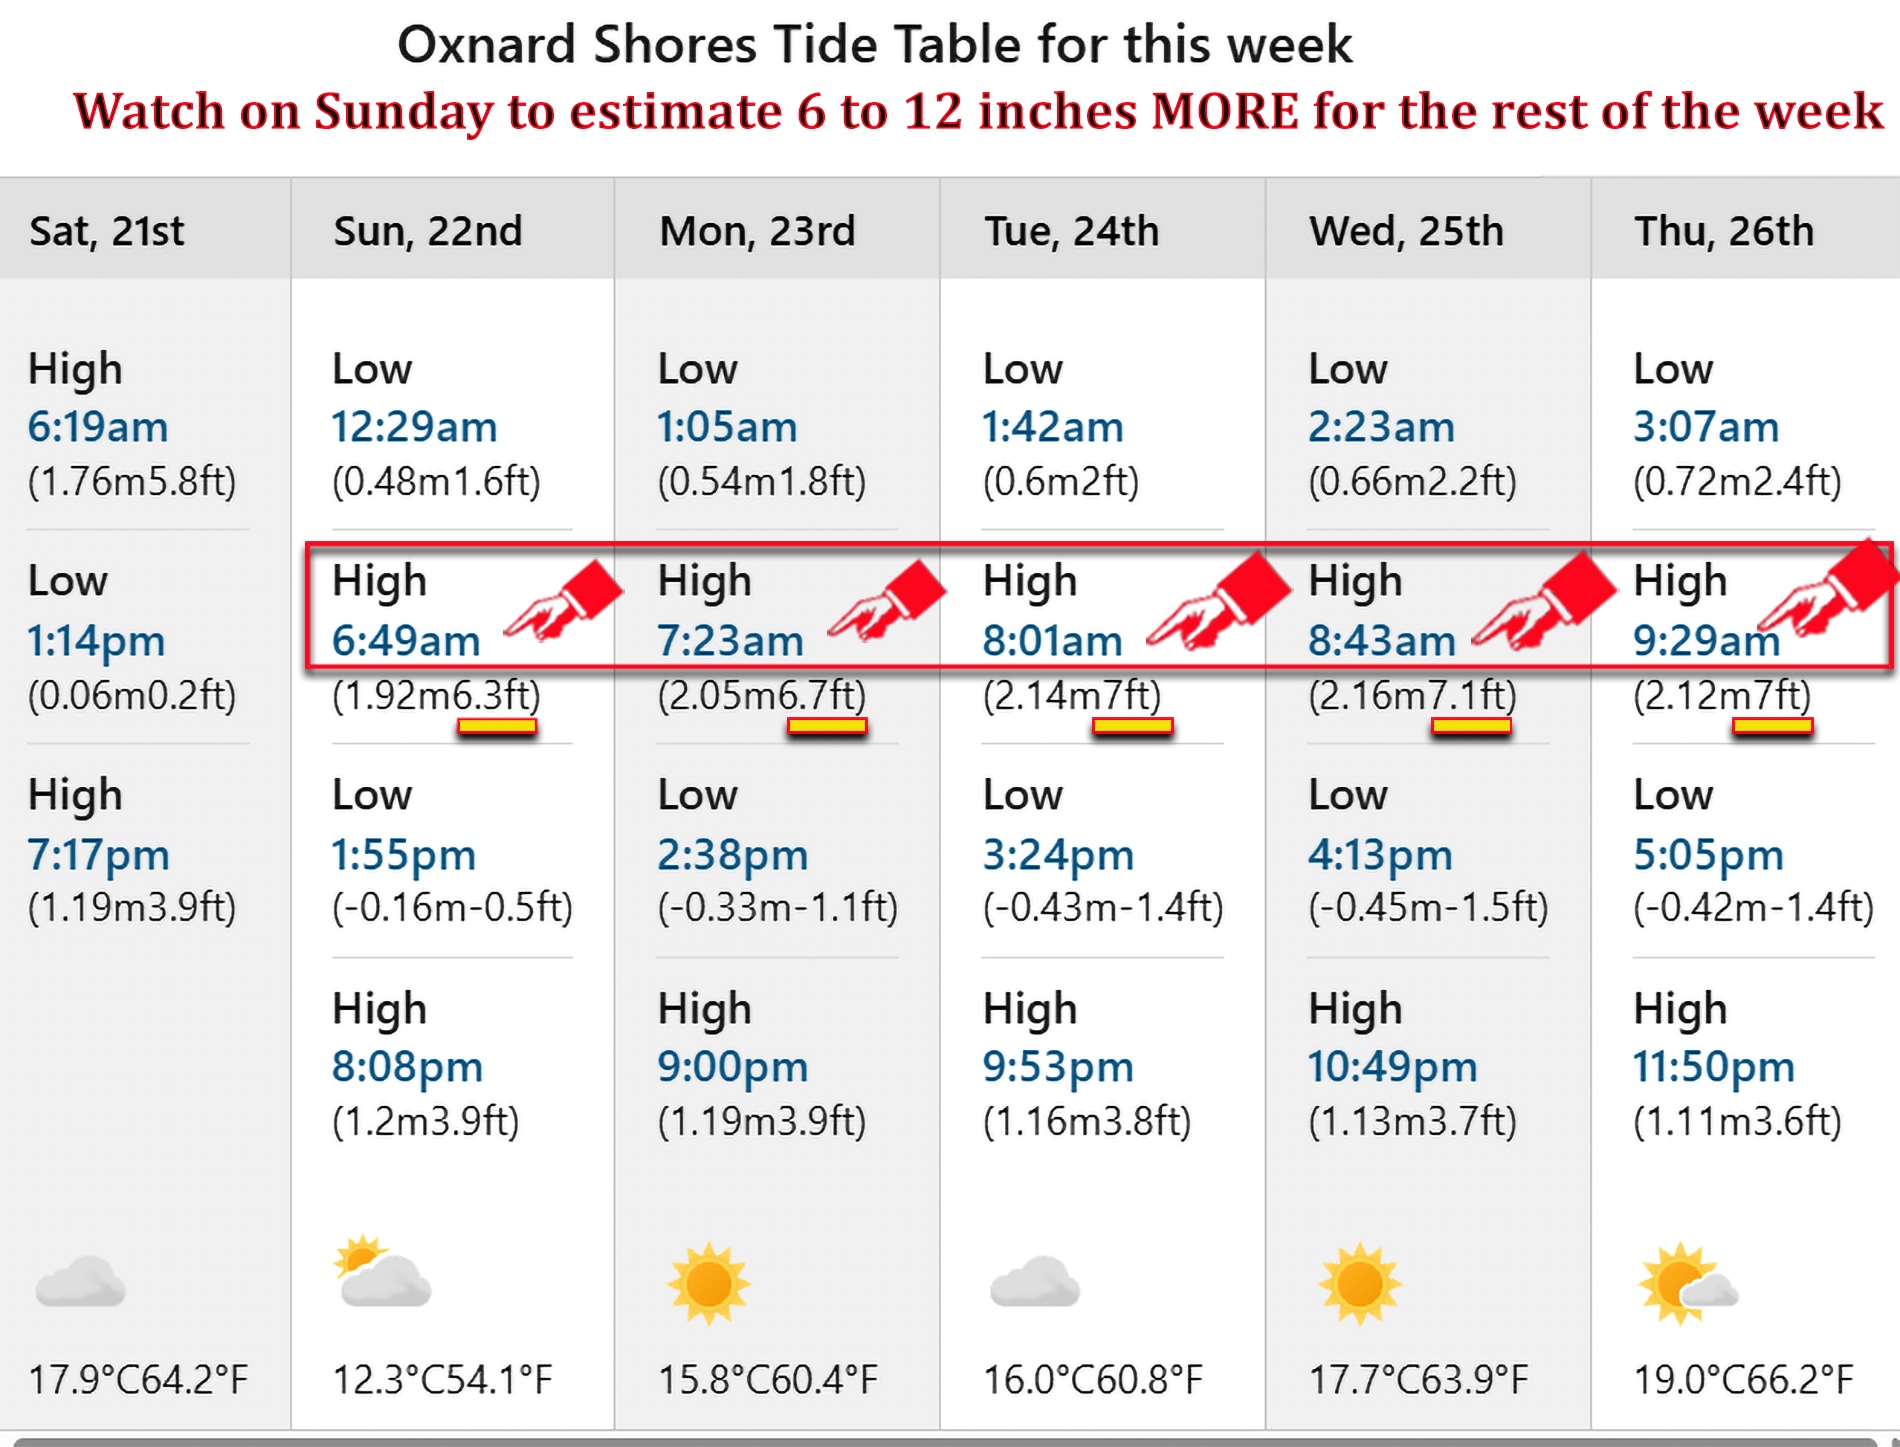
The morning high tides build over the weekend. Here are the astronomical tide predictions for nearby Port Hueneme, in Pacific Standard Time. Heights are measured in feet above Mean Lower Low Water (MLLW), the reference level used in this tide table. Use these times as a guide for when to check your dock. Actual water levels in Mandalay Bay may run higher. NOAA Port Hueneme tide table
| Date | Predicted morning high | Tide-table height |
| Sunday, November 22 | 6:50 a.m. | 6.3 ft |
| Monday, November 23 | 7:24 a.m. | 6.7 ft |
| Tuesday, November 24 | 8:02 a.m. | 7.0 ft |
| Date | Predicted morning high | Tide-table height |
| Wednesday, November 25 | 8:44 a.m. | 7.1 ft |
| Thursday, November 26 | 9:30 a.m. | 6.9 ft |
The most complete published graph I have found is from NOAA.
NOAA Update, November 4, 2026
https://oceanservice.noaa.gov/news/nov26/california-record-water-levels.html
California water levels break records
Above-normal high tides, warm waters, and El-Niño push water levels to new heights
November 4, 2026
Last week, communities along the California coast felt the effects of this year’s strong El Niño, as high water levels inundated the state’s low-lying areas. NOAA tide gauges throughout the state captured these water levels with some locations seeing their highest readings ever, with observations that date back more than 100 years.
Record Water Levels
From October 24 to 30, 2026, locations on the California coast experienced heightened water levels — which are measured above Mean Higher High Water (MHHW), the average of the highest tides for that location. Four locations reached their all-time highest observed water levels:
- San Diego, CA – 2.80 feet above MHHW
- La Jolla, CA – 2.65 feet above MHHW
- Los Angeles, CA – 2.70 feet above MHHW
- Santa Barbara, CA – 2.65 feet above MHHW
Other locations saw water levels break into their top-ten highest observed:
- Santa Monica, CA – 2.72 feet above MHHW (2nd highest on record)
- Port San Luis, CA – 2.35 feet above MHHW(4th highest on record)
- Monterey, CA – 2.20 feet above MHHW (7th highest on record)
NOAA’s tide gauge at San Diego, California, captured its highest water level on record, 2.80 feet above Mean Higher High Water (MHHW) on October 27, 2026. Credit: NOAA
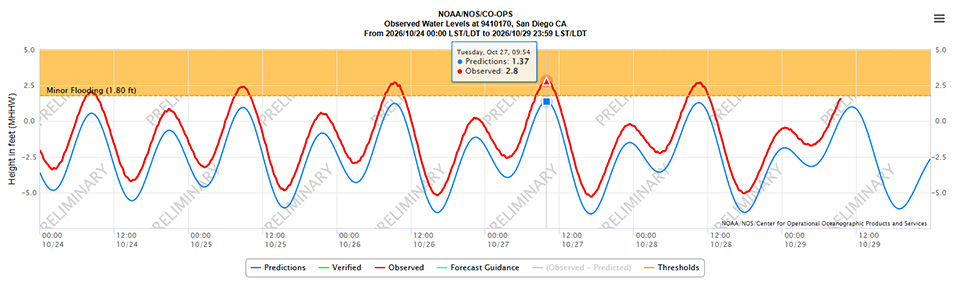
Note: The graphic above is from 2026/10/29 Observed Water Levels San Diego
the Blue line is Predicted and the Red is Observed